The comparison tool, developed for ease of use, allows users to analyze their horses under similar training settings by simply selecting the same training day, type of work, or intensity.
This feature’s goal is to provide visual cues when comparing two horses (or a horse with itself), based on the main factors you’ve predefined using your Data Success Manager.
Its benefits
There are many advantages to using the comparison tool, including the following:
-
- Analyse your horse data in a different, more visual way.
- Quick and easy to use.
- Easily compare training sessions under the same conditions (particularly boot to boot).
What information will you obtain?
For a given task, and for the same conditions (track, ground conditions, type of training, etc):
-
- Which horse was the fastest?
- Which horse made the most effort?
- Which horse recovers best?
- Which horse has the most action?
- Which horse has the fastest stride frequency?
- Is the horse in the same condition as before its last victory?
- How has the horse changed since last year?
- Which of your 2-year-olds / 3-year-olds seems to perform best in canters?
Why use it?
Of course, the main function of this tool is to COMPARE! And it’s important to note that there are many opportunities for comparison:
- HORSES THAT HAVE DONE THE SAME WORK – same batch, boot to boot, identical type and, above all, under the same conditions (tracks & ground conditions).
Here is an example of two 2-year-old fillies who did boot-to-boot work. The training conditions were therefore similar. Overall, the horses put in the same level of effort, with similar speeds and times. Mr Arion nevertheless clocked the best 1000m in 63.36 seconds, almost a second slower than Data Pool.
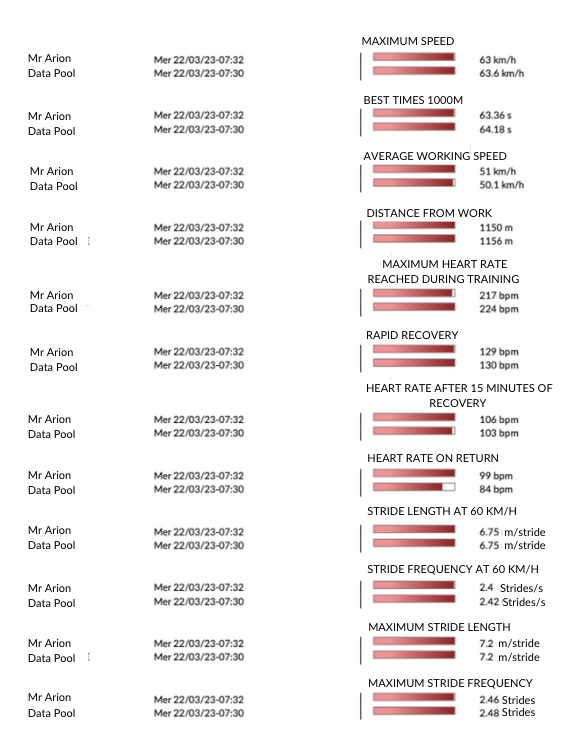
As far as fitness levels are concerned, from an effort absorption point of view, the two horses seem to be at more or less the same level. In fact, the BPMs during rapid recovery are fairly similar. However, if we relate these data in % of FCmax, we can see that Data Pool (130/224 = 58%) recovers a little better immediately after the effort. In fact, Mr Arion is at 59%.
Finally, in terms of fitness, the heart rate 15 mins after exercise as a % of FCmax allows us to confirm that these two young colts are showing very promising aptitudes, as they are both below the 50% target.
- HORSES OF THE SAME AGE
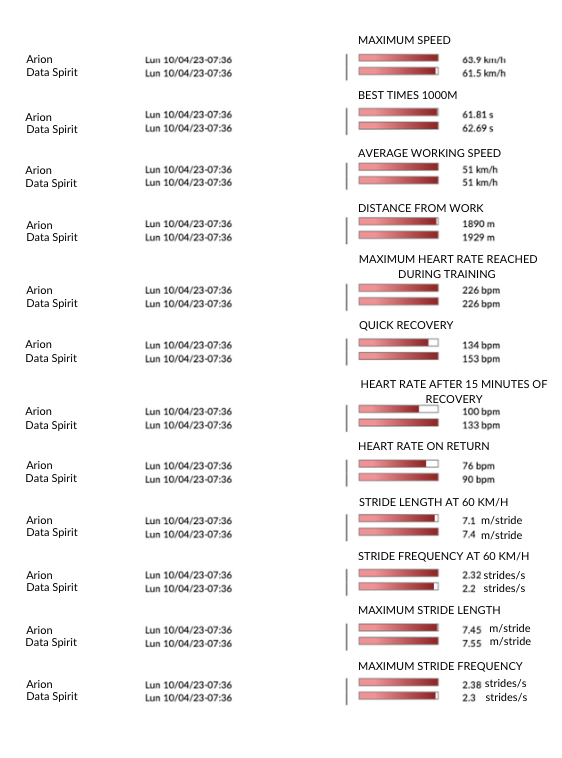
Here are a few good three-year-old horses who won groups in their first season. Let’s take a look at the work done on the 13th of March, during the same lot. This enables us to ensure that the training circumstances are comparable.
We can see that Arion was a little faster than Data Spirit, but that overall the average speed of work was the same.
The horses had the same maximum heart rate, but Arion showed a better level of fitness, since for the same exercise, the effort he put in appeared to be less than that of Data Spirit: Arion’s recovery data was better than that of Data Spirit.
Finally, it should be noted that these horses have different locomotor profiles – Data Spirit has a greater stride length than Arion, who has a higher stride frequency.
- The data of a good horse when he was young, with the data of a promising young horse
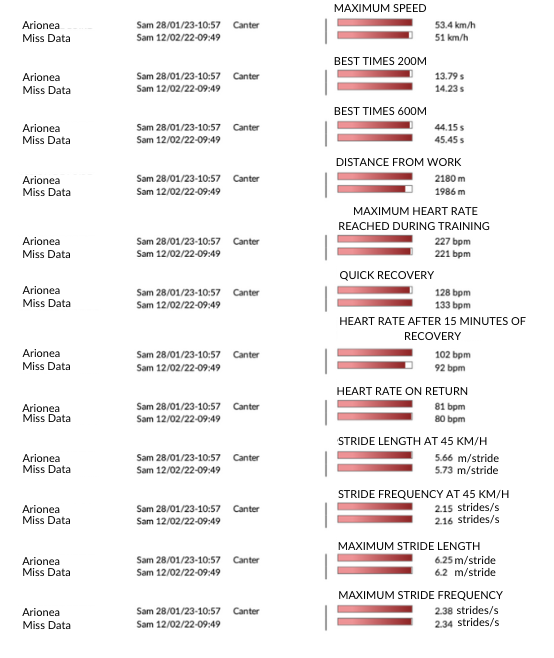
So for recovery, let’s look at % of max heart rate to make a perfect comparison between the two fillies (as a reminder, max heart rate gives us no indication of a horse’s ability, it’s recovery that allows us to judge their state of fitness). The lower the %, the better the recovery. ARIONEA’s recovery is therefore slightly better than MISS DATA’s last year, but it’s still very good (we generally look for values of <55% for fast recovery and <50% after 15 minutes). What’s more, she’s going faster on average too.
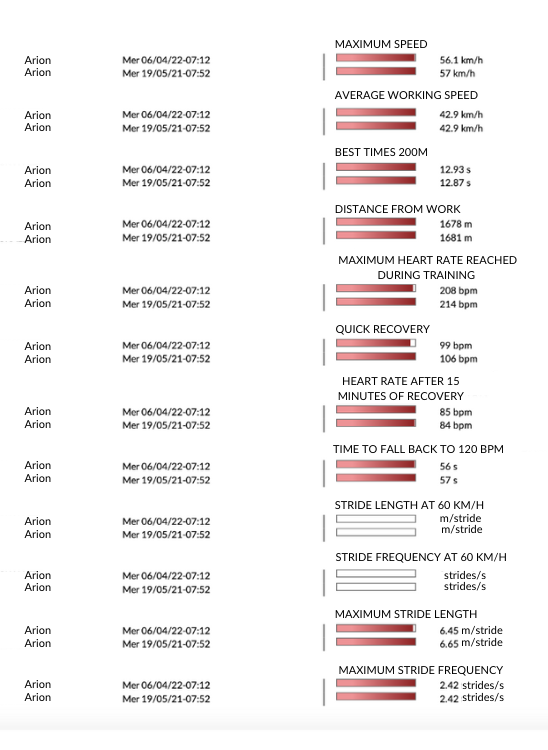
- The same horse over time, to follow its development and preparation before a deadline.
Here is the example of Arion. He is a French Group horse who was preparing for an important race before training on 19/05/21. Having won this race, the training data can be used as a reference to reach before another major event.
Arion ran another important race on 10/04/22, and in order to ensure his horse’s fitness, the trainer compared the data from his last training session with the reference data from last year.
We can see that the two workouts are very similar: speed and the best 200m are almost identical. However, when we look at the best 600m we see a difference, which is favourable to the last training session. The horse exceeded his pre-performance references, which bodes well for his next race! What’s more, he didn’t reach his maximum heart rate, which shows that the effort didn’t put him in the red.
How do you use it?
It’s quick and easy.
-
- Go to the comparison tool in the menu of your EQUIMETRE platform.
- Then just select the workouts you want to compare.
- Analyse your data, and if you wish, download the PDF report of the comparison with a single click to share it!
Pro tips – Make sure the 200m are completed in a similar time range to compare workouts of similar intensity.
Key words: comparison tool, EQUIMETRE, heart rate, effort, recovery data, etc.

