Horse racing speed analysis is a central issue since the key factor to winning a race lies in managing speed throughout the race. All races are different and many events disrupt the evolution of speed during the race. In order to understand how the parameters influence the race, it is interesting to get how the races are run and thus, answer the different questions that one can ask oneself when watching a race.
How does the ground affect speed? To what extent do Group 1 winners run faster than handicapped horses? From one country to another, how do racing and training strategies vary?
1. Speed definition
The speed of a horse is the ratio between the distance he’s going to run and how long it’s going to take him to travel that distance. Speed can be expressed in several ways according to geographical areas, and by discipline. Many factors can influence speed and in this chapter we will assess their respective influences.
In Europe, speeds are classically expressed in km/h, i.e. the number of kilometers travelled in an hour. More rarely is the speed expressed in meters per second (m/s).
In English-speaking cultures, we’ll talk more about “miles per hour” (mph, 1 Mile = 1.6 Km). When trotting, another way to analyze speed is preferred when studying mileage reductions. One then speaks of minutes per kilometers (min/km), or the number of minutes it takes to walk through a kilometer.
2. Average speed and finish line
The highlight of a race and the most beautiful impressions of speed often occur in the final straight line, at the finish during which the race ends. But these impressions of speed and acceleration are not always true in practice. Is the straight line always run faster than the rest of the race?
How do horses and jockeys optimise their speed to preserve their finish ?
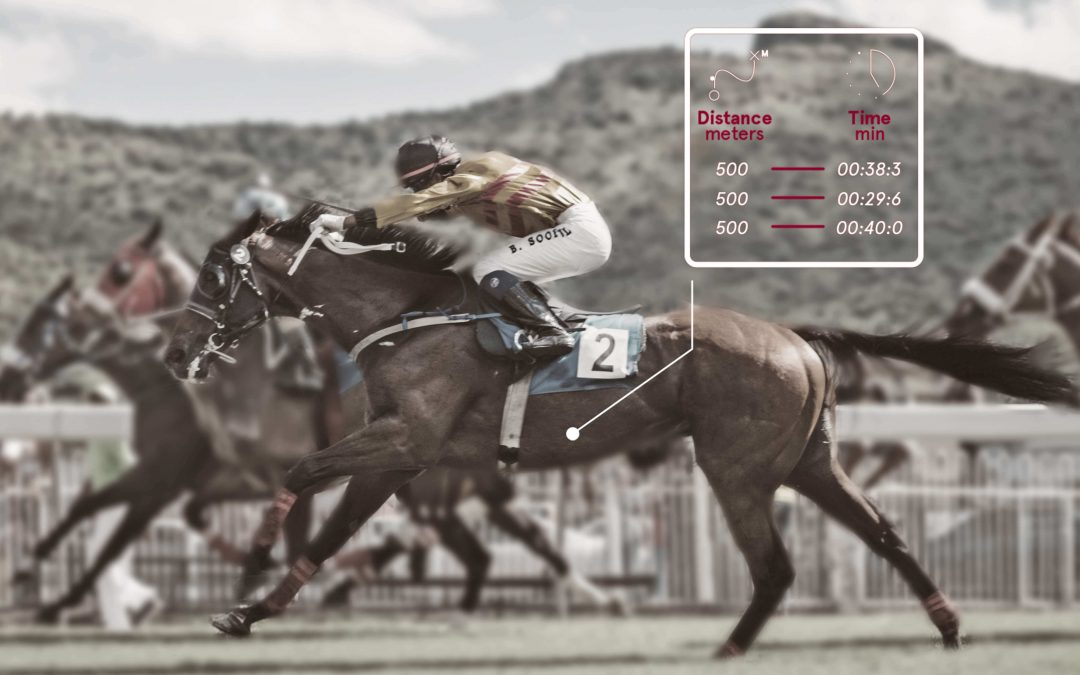
Split times – or intervals – are an ideal tool for horse racing speed analysis. They can shed valuable light on the way races are run, particularly because they allow you to analyse the different phases of the race, acceleration strategies and speeds in the final stretch.
Logically, we can expect to see slower rhythms, gradually increasing, then faster in the end of the race, and slower again at the end of the race when the horses peak in their speed at the finish and slow down in the last meters because they have exhausted their energy reserves. However, as speeds are affected by the curves and topographical undulations of the track, this remains a very general rule.

3. Speed and split analysis

The graph above compares race speeds and split times for grass races at the Chantilly, Deauville and Longchamp racecourses. First of all, it can be seen that the race pace is on average higher at Chantilly than at Deauville and Longchamp.
The horses print a reasonable race pace of around 55km/h and gradually accelerate over the last 600m.
- At Chantilly, the speeds over the last 600 meters are quite similar to those of the race pace.
- At Deauville, the speed of the last 200 meters is slightly lower than the last 400m-200m, which shows the difficulty of the track.
- At Longchamp, the deceleration in the last 200m is even more pronounced due to the slope in the straight line that limits the horses’ ability to accelerate.
It is noticeable that depending on the distance the racing strategies are different, therefore the training strategies have to be adapted according to the targeted race. In short races, the horse must be able to maintain a high speed from start to finish. At longer distances, the horse must be able to maintain a correct speed and then accelerate. The strategy will then be based on the level of this top speed, the higher it is, the later the horse can be launched, surprise his opponents, and boost the horse’s morale by letting him overtake his competitors. To give a rough estimate, over the last 200 meters, 3 km/h of difference between two horses induces about 10 meters of difference, the slowest horse must therefore be thrown 10 meters earlier to have a chance to cross the line in the lead.

It is interesting to compare these French analysis with international strategies. What about Dubai, for instance?
Let’s look at the times of the races at the Meydan racecourse in Dubai. On the Dirt, we notice that the race is run very differently. The race pace is very fast (up to 600m after the start), then the speed decreases on the last 600- 400m, stays the same on the last 400-200m and drops drastically on the last 200m. We can see that the room left for acceleration is very limited. The horse that will win the race is the horse that will be able to maintain its speed and resist tiredness until the last moments. The level and this speed profile make one think of a typology of race on heavy ground. This means that it will probably be rather powerful horses who will carry the victory.

On the grass at Meydan, the tracks are run in a slightly more similar way to French races. Above 1400m, the race pace is moderate then the horses gradually accelerate to reach their maximum in the last 400-200m, then the average speed drops sharply in the last 200m. In contrast to France, the horses are launched much earlier with an average speed in the race pace and in the last 600-400m about 5% higher. The average speed in the last 400m is slightly lower than in France.
It is therefore noticeable that racing strategies from one country to another, from one racecourse to another, or from one track to another can be very different. In what follows, we will attempt to quantify the impact that the different parameters can have on the way the race is run.

Details of split times during races in Chantilly, Deauville, Longchamp (France) and Meydan (Dubaï)
Keywords: horse racing speed analysis, finish line, acceleration strategies, speed strategies, analysis of intermediate times, international