We could have named this article “Making race entries: a conundrum”, but knowing how to solve this conundrum is maybe what makes the best racing teams so successful. Magicians or genius strategists?
Data can help backing up your feeling, but also guiding logical and rigorous decisions. Here are 5 steps that you can incorporate to your entry strategy.
1. Choose the distance with confidence by using your own benchmark
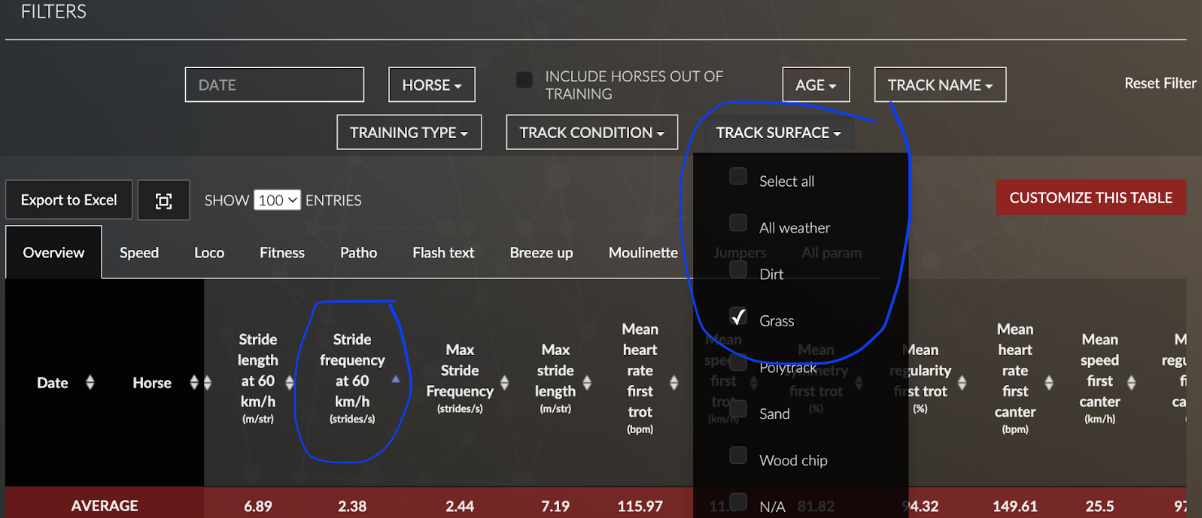
Stride frequency gives you indications on theoretical preferred distance: the higher the stride frequency, the shorter the distance and vice versa. Sort your horses on Stride Frequency at 60km/h on grass (click on parameter to sort), it should give a theoretical ranking of your horses by preferred distance.
The horse is between 2 horses, you’re sure of the distance? Bingo!

Tips for the lazy ones: just ask your data success manager to get you a locomotor profile report!
2. Include the horse surface preference in your decision-making
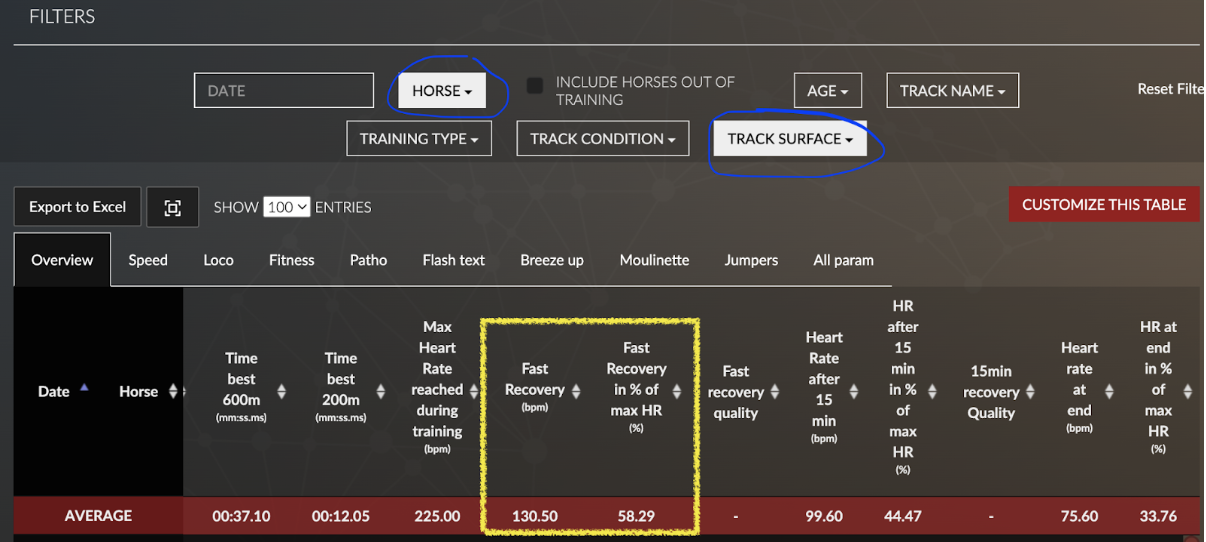
Most of the horses prefer grass over poly or dirt, what if it was not the case for this one? Filter your trainings for this horse for one surface, and look at the average Fast recovery. Then filter for another surface and look at the same average. The lower average in Fast recovery will indicate the horse finds it easier on that surface.
Run the same analysis by comparing one horse’s average compared to your stables’, you’ll have an idea where he stands compared to the others. Ex: one horse might not find dirt or heavy ground easier than grass, but he might be actually doing better than the others on that surface.

3. Running clocking data against past speed statistics for the race
Now that you have distance and surface choice backed up by data, find past speed data for the targeted remaining races on your list. Look for last 800m and best 200m, and compare it to the best records of the horse. It should give you a fair idea of whether the horse should be capable of aiming at a good performance in the race.
4. Use the “screenshot training” method to make sure the horse is at peak fitness level on the said date
Not yet sure of the timing? Use past fitness data using the infamous “Screenshot training” method. Take the last training before a race you think was a good benchmark for the horse. This monitoring is a screenshot of the horse fitness level at this exact time. Was the race a good performance, then you need to find similar or better fitness level, was it bad, you know the horse needs to be better.
Best parameters to look at for fitness assessment: HR after 15 minutes in % (target is below 45% for fast works), time in zone 5, oxygen debt time.
5. Prepare the racing strategy according to the horse acceleration strategy
Can we run hidden, or do we have to be pace setters? Looking at the acceleration strategy, look at the locomotion curves, ideally on a training with a change of speed inside the work.
Green line clearly above: gradual acceleration using stride length, the horse will need time to build momentum and extend his stride → start accelerating early.

Orange line clearly above: explosive acceleration using stride frequency, the horse has a strong turn of foot potential and could be able to quickly change pace in the race → possibility to wait more to ask acceleration.

Curves intertwined: polyvalent acceleration using both stride frequency and length, typical of a miler, both types of strategies are possible.

At Arioneo we share the strong belief that it exists one win for every horse, we just need to find the right race. Let’s hope data will help your process, if you want to follow those steps to give it a try with your data success managers, just book a meeting with them or ask for a report in Whatsapp.
See you in the winner’s enclosure!
Key Words: stride frequency, horse, data, Arioneo, data success manager, curves, strategy
Photo: Eleonore Groux

