As racehorses are true athletes, monitoring their health and performance is essential. Monitoring a racehorse over time will allow us to examine the three most important aspects of a racehorse’s health, such as fitness, speed and locomotion. In this article dedicated to the longitudinal monitoring of athletic horses, we will discuss the longitudinal monitoring of the speed and locomotion of racehorses.
1. Evolution of speed work for young horses
The evolution and adaptation of workloads for young horses is essential in the early stages of training. By following the complete evolution of the work carried out with a horse, an objective vision of its progress is obtained. The data collected in parallel with training allows the trainer to have precise knowledge of the horse’s capacities, data which feeds into the decision-making process during training and engagements.
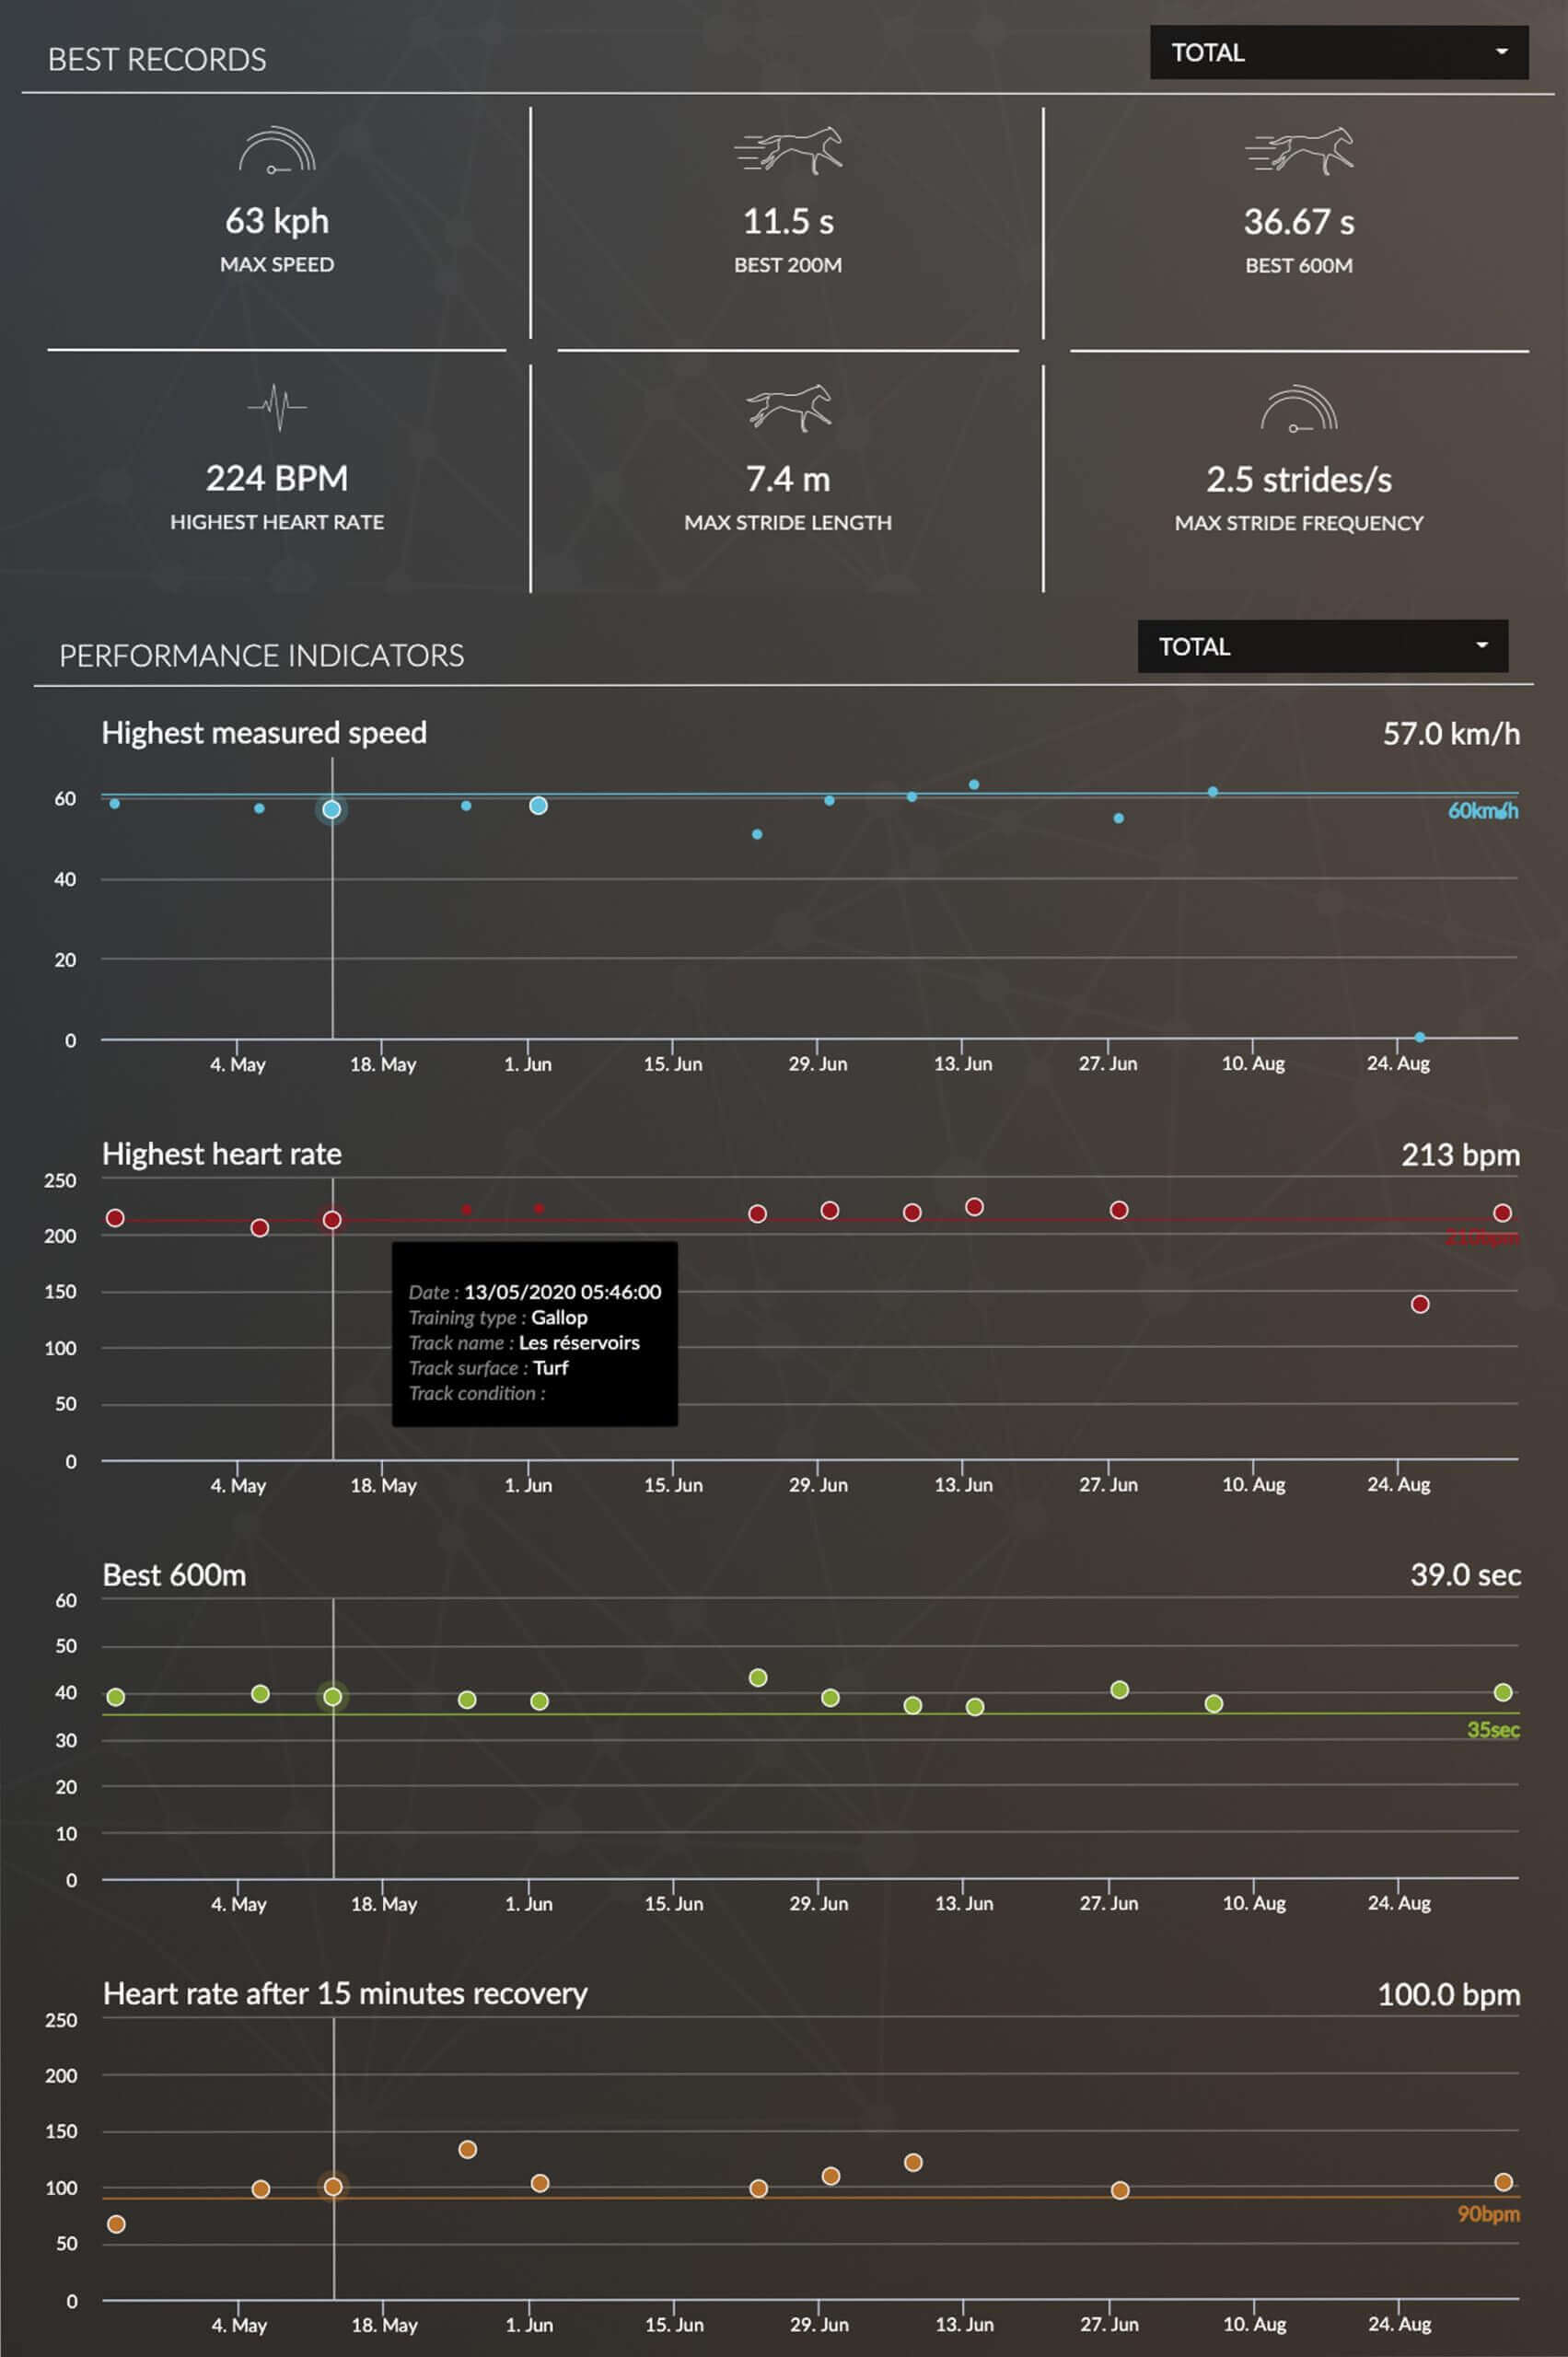
In practice, the new interface of the MyHorse page on equimetre.com enables the most accurate longitudinal following for each horse present at training. In fact, all the horse’s monitored training sessions are listed there. This page provides an overview of the key data for each horse’s training: the evolution and improvement of a horse’s performance can be seen.
The aim of longitudinal tracking in young horses is to measure the demands of the work, especially on speed. The graphs of Max Speed and Best 600m show a line indicating reference data during the race (600m in 35s, 60km/h). The objective is to observe an improvement in training times, an improvement which can be measured using the recovery data corresponding to each speed data. From one workout to the next, the objective is to increase speed without deteriorating recovery. If speed work has been particularly intense (poor recovery), perhaps a significant recovery time or an active recovery session is necessary.

2. Decide on a race entry thanks to the reference times of the race
For a trainer wishing to enroll one of his horses, it may be relevant to compare the intermediate times in the horse’s training and the reference times of the race over the last few years. Although from one year to the next some of the parameters, such as the level of the lot or the quality of the ground may differ, the topography and the track do not change. Thus, such a comparison gives a precise idea of the horse’s level in relation to the level required for the race in question.
Here we will take the example of an Australian horse that ran on September 12th. The last two major works were done by the horse on August 25th and September 8th. During these last two training sessions, the distance of the target race (1200m) was worked on in race conditions. The horse therefore set two reference times over 1200m: 1.17.2 on 25/08 and 1.17.8 on 08/09.
Over the last three years, the level of the horse to be engaged can be evaluated with the level of the winners of the previous editions. The reference times every 200m are compared to the times every 200m in the last two training sessions of the horse. It can be seen that during the 600m following the start, the horse maintains a stable gait, 2 to 3 seconds slower than the race times. However, it appears that between the finish in the race and the horse’s finish in training, the times are equivalent. This suggests that during the two training sessions the horse has maintained a stable performance level “without pushing too hard” before actually starting in the last 400 metres.


All this analysis led the trainer to engage this horse in this group 2 race over 1200m. Thus, the analysis is verified thanks to the intermediate times of the horse during the race since the 600m following the start were much more in phase with the times of the winners of the previous years. The horse finished second in this Group 2 race.

Key words: racehorse follow up, racehorse speed, horse workload, longitudinal follow up, racehorse reference time, split time comparison, last 600 meters
3. Knowing the locomotion profile thanks to longitudinal tracking
To build up the locomotor profile of a racehorse, two indicators must be analysed: stride length and stride frequency. In racing, if the stride becomes longer it will logically be more difficult to sustain a high pace. Likewise, when you want to accelerate the pace of your strides, it becomes difficult to maintain a long stride. Finally, pace is often directly correlated with endurance: a high pace is difficult to sustain over a long period of time and will therefore hinder high endurance.
Thanks to these two indicators, it is possible to identify two theoretical profiles according to the type of race: the sprinters who will be oriented towards short distance races and the milers or stayers who will be engaged in long distance races.
The sprinters will have a high stride-rate, which they develop over long distances, allowing them to reach their maximum speed quickly.
Milers and stayers will have a low stride rate and a high amplitude that allows them to develop their speed over the distance.
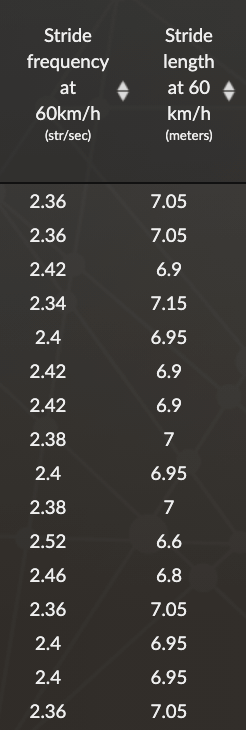
In this example, we notice that the average stride rate of the horse at 60km/h is less than 2.4.

In theory, this means that this horse is a miler and should be run in races from 1600m to 2300m. The trainer therefore used the Analytics functionality of the Equimetre platform to get a more precise idea of the horse’s locomotor profile and align it with races adapted to its profile. In practice, this horse obtained its best results over 2000m distance: the data analysis enabled the trainer to extend the horse and find its preferred distance.

