Warning: number_format() expects parameter 1 to be float, string given in /var/www/wordpress/wp-includes/functions.php on line 425
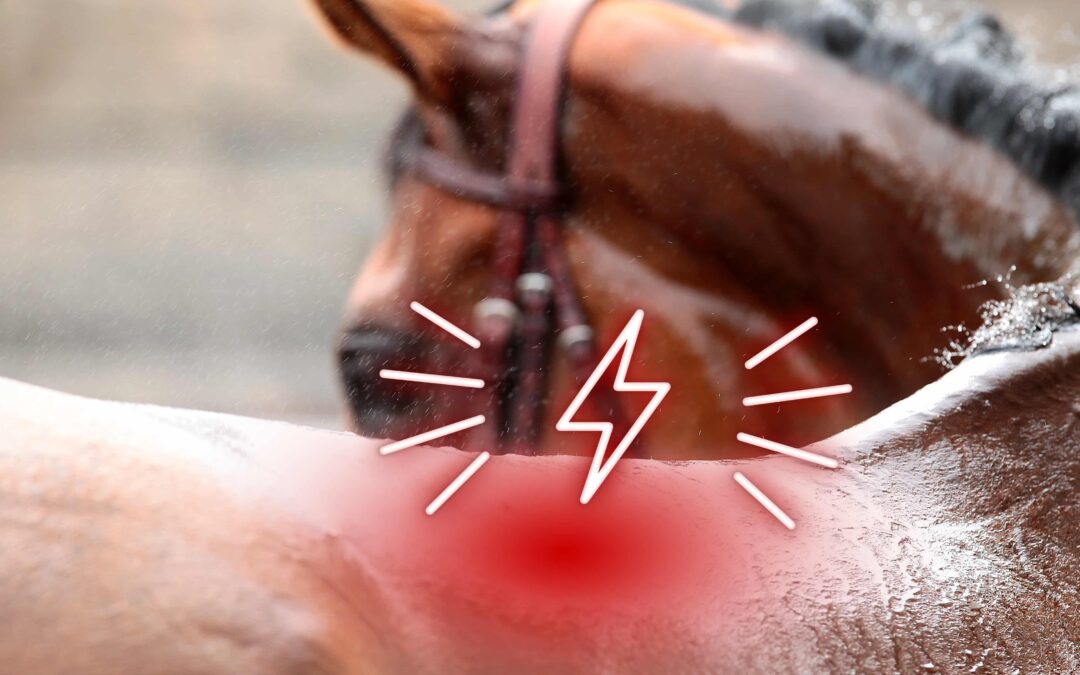
What are kissing spines?
Kissing spines are a common source of back pain in horses. In a healthy horse, the spinous processes are uniformly aligned along the spine, allowing the horse to extend and flex his back normally.
When a horse suffers from kissing spines, the spinal processes are very close together and may even touch. This causes back pain to the horse and reduces his back mobility.
Kissing spines can occur occasionally, when the horse is in a certain posture, for example by contracting his back, or permanently.

Photo source : southmountainequine.com
Context
Arionea is a 3 year old filly. After her pre-training, she was sent to a trainer in Cologne to continue her training. Training went very well, so Arionea started racing.
Her first race was at a racecourse with flat tracks. Arionea looked very comfortable and performed well in this race. Her second race went just as well. The third race took place at a racecourse with a hilly track and the filly found herself in difficulty. She underperformed despite every indication to the contrary.
Her trainer didn’t understand this sudden change in her result, although her training was encouraging, so he decided to send the filly back to her pre-trainer to rest.
Arionea gradually returned to the exercises she used to do at her pre-trainer’s, but this time on tracks with a positive incline. Her pre-trainer initially noticed that the filly was different under saddle, especially during climbs where she showed discomfort. To confirm this feeling, they decided to equip her with EQUIMETRE to collect data.
➡️ For more information about the benefits of the athletic horses’s medical follow-up, we recommand this article.
How can Arionea’s sudden underperformance be explained?
What indicators to analyse?
Several parameters of the EQUIMETRE platform were used to analyse this case:
- Speed curve: used in addition to the heart rate curve, it allows to quantify the exercise type (rest, sprint, canter, etc.).
- Heart rate curve: this gives an overview of the horse’s heart rate during the exercise.
- Tilt table: used in comparison to the heart rate, it helps to visualise the amount of effort required from the horse in relation to the gradient of the terrain.
Analysis
Comparing Arionea’s heart rate and speed curve, it can be seen that the filly has variations in pace but her heart rate is still high. This should follow a similar trend to the speed variations, but it doesn’t.

Graph of Arionea’s speed (blue) and heart rate (red)
The tilt table is very useful in this case, to sharpen the analysis.
As soon as the inclination is positive, the average heart rate recorded for 200m suddenly increases. What is particularly interesting here, is that the average heart rate decreases as soon as the filly gallops downhill again.

Table showing the evolution of the heart rate according to the difference in altitude

Interpretation
The first point of interpretation is the complexity of the track, which puts horses in difficulty. As the course is uphill, this discomfort could extend to the whole group, given the youth of the horses and therefore their still improvable fitness. To verify this hypothesis, other horses of the same age as Arionea were monitored with EQUIMETRE, with the same track conditions on similar exercises.

Comparison between the charts of Arionea (left) and the charts of another horse in the same group (right)
It was shown, from the heart rate curve and the speed curve of the other horses monitored, that the problem was specific to the filly. The other horses peaked at a heart rate correlated with their speed, which dropped off once the effort was over. In addition, this high heart rate curve was repeated several times for Arionea, which confirmed the feeling of the filly’s discomfort: her heart rate increases considerably when climbing.
Her pre-trainer then decided to call his vet who diagnosed Arionea with kissing spines. The filly was in pain when going uphill climb, because it is mostly during this type of exercise that the horse contracts its back. The positive incline compressed her spines and emphasized the pressure points, resulting in an increased heart rate in reaction to the discomfort.
Arionea didn’t show any signs of pain on a flat track as this type of exercise allows her to lengthen her back.
Conclusion
Data were here to support the pre-trainer’s feeling and offered tangible information on the filly’s physical condition. By comparing with other horses, with similar characteristics, the data allowed to identify that the filly was suffering during the positive inclines. It is thus interesting to follow several horses on a regular basis in order to have a comparable data base over time.
➡️ For more information about the role of data to detect pathologies in racehorses, we recommand this article.
Keywords : kissing spines, racehorses, pre-training, data analysis
These articles may also be of interest to you

DATA & RUGBY: Interview of Thomas LOMBARD
This week, Arioneo had the opportunity to meet Thomas LOMBARD, General Manager of the Stade Français Rugby to discuss the arrival of data in the world of rugby and the improvements it has brought to this sport.
Read a training with EQUIMETRE
By training with EQUIMETRE, you collect data on the performance of your horses. A good understanding and reading of this data is essential after each training session.
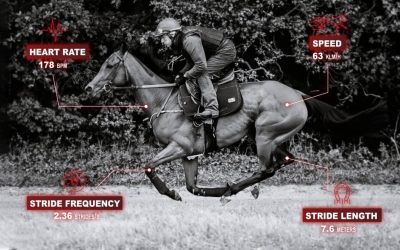
Optimising racehorses locomotion performance
It is important not to neglect the racehorses locomotion performance as stride length and stride frequency have an impact on the fatigue felt by the horse.
BROWSE AMONG OTHER CATEGORIES
Equine physiology
Science & health
Data & Sports
Racehorse training
Stride analysis
Standarbreds
Equimetre
Speed
Young racehorses
SUBSCRIBE TO OUR NEWSLETTER
Let’s stay in touch: to get our latest articles and follow EQUIMETRE news, fill-in this form.