Warning: number_format() expects parameter 1 to be float, string given in /var/www/wordpress/wp-includes/functions.php on line 425
By carrying out trainings with EQUIMETRE, you are able to collect data relating to the performance of your horses. The EQUIMETRE sensor measures more than 100 parameters at each training session and the interpretation algorithms are scientifically validated. This data is dedicated to help you in your decision-making process, as well as to carry out a longitudinal follow-up of the horse in order to engage it at the right time on the right race. This is why a good reading and understanding of these data is important after each training session. The trainer can also analyse in detail the performance of the horses in his stable by comparing several horses on the same type of exercise.
The EQUIMETRE platform
The EQUIMETRE web and mobile platform concentrates all the data collected during each training sessions of your racehorses. On the latter, you will be able to find all the training sessions for each horse, compare the different training sessions of the same horse with each other or compare the training sessions of several horses with each other.
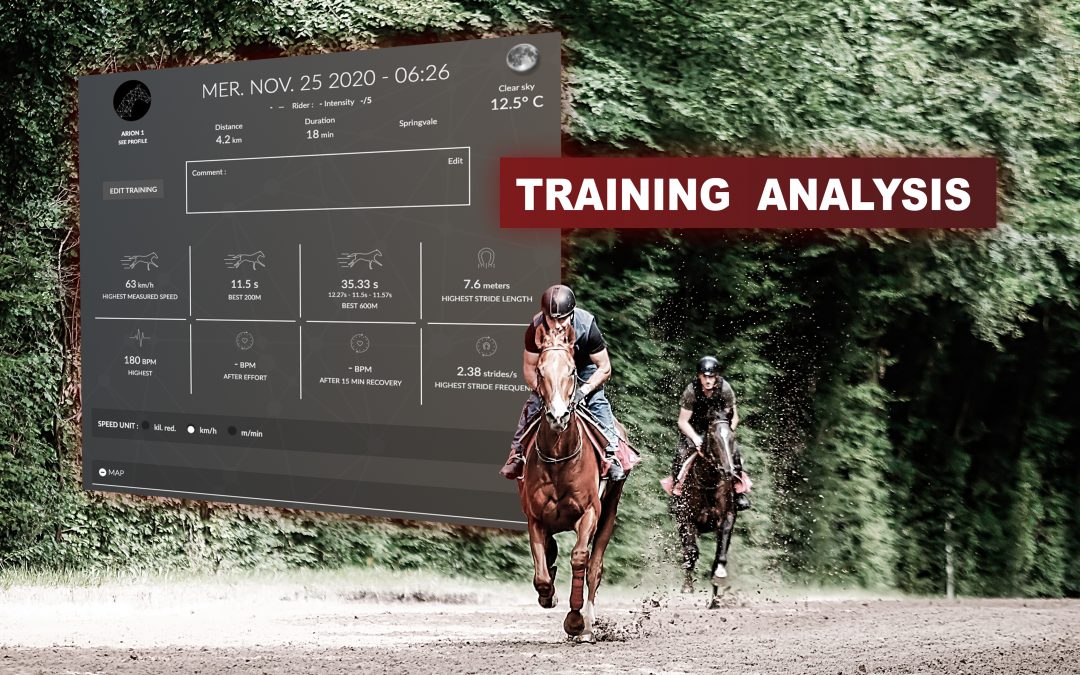
Training Overview

By going to the training page of a particular horse, you will be able to find the overall training summary. This global summary displays key data that allows you to see at a glance how the horse performed during this training. The maximum speed measured as well as the best times over 200m and 600m are indicated. Key data for the horse’s stride rate and stride amplitude are also shown. Finally, this overall summary provides and analyses the key figures in terms of the horse’s heart rate by indicating the maximum heart rate during the effort and the heart rates after the effort and 15 min after the effort. Our algorithms rate the two pieces of post-exercice heart rate information relating to the heart rate after as poor, fair, good to excellent.
Average gait and heart rate
This second section gathers information about the horse’s average gaits during training as well as the different heart rate zones reached.
The pie chart shows the different gaits of the horse during training, easily identifiable thanks to the different colours. Distance, time, average speed and average heart rate at this pace complete the graph.
In parallel to this graph, an evolution grid indicates the level of use of the horse’s cardiac system according to gait and beats per minute. This grid is divided into 5 sections, from the most moderate to the “hardest” for the horse. For each level, the time spent on it is specified as well as the percentage of training time during which the horse remained at that level.


Map
On the training map, it is possible to visualize all the GPS track that the horse has made during training. The whole point of this map is to be able to review and re-read in real conditions a specific part of the training, depending on where the horse was or its pace. A point representing the horse moves on the map and the key data displayed in the box on the right changes as the horse progresses along the course. Each gait is represented by a colour: yellow for walk, orange for trot and red for canter.

A reading bar is present at the bottom of the screen throughout the navigation. By clicking directly on a point on this timeline, it is possible to select a given moment of the horse’s training and to visualize its parameters with precision. Each block is linked to this timeline and represents the physiological and sporting data of the horse at a specific moment of the training, through the GPS point on the map, the cursors on the graphs and the highlighted lines of the intermediate time table.
Graphs
In this section, a set of four graphs makes it easy to view the speed, heart rate, stride amplitude and stride rate data collected throughout the workout.
Thanks to our interpretation algorithms, these parameters are represented in the form of easy-to-read interactive curves.
The first graph allows you to follow the horse’s progress during the exercise by measuring its speed. The second graph tracks the evolution of the horse’s heart rate from the beginning of the training, during and at the end of the exercise in order to know how the horse reacted to the effort, to visualize and analyse the stabilisation time of its heart rate after work and to analyse the quality of its recovery when on his return to the stable. Locomotion indicators make it possible to objectify the horse’s physical capacities according to the evolution of its stride size and the increase in its pace during training.

Split times grid

Finally, the last section of the training page allows you to view the workout split time chart. This table is a real asset when it comes to choosing the engagement for a horse. Thus, thanks to this table, you will be able to study the time and the average speed that the horse has achieved according to the gaits and segments of the training. By clicking on the segment that particularly interests you, you will be able to visualize the progression of the horse’s acceleration and the moment when its speed peaks, as well as the evolution of its heart rate and the associated locomotion parameters.
Keywords: training follow-up, equine technology, racehorse monitoring, fitness evaluation, recovery capacity, speed capacity